With Ontario’s first cap-and-trade auction slated to launch later this month, all eyes were on the results of California’s and Quebec’s first 2017 auction.
 After selling nearly 90% of available permits in the last quarterly auction held back in November, the sunshine state and la belle province latest results of only 18% of allowances sold show a low demand, despite the success of the cap-and-trade program.
Before the doom and gloom headlines abound (oh, wait, too late) the auction results are not actually a solid barometer for telling us whether cap-and-trade is working. Ultimately, the test is whether or not emissions are coming down, and as we reported, these latest result speak more to external factors such as future program uncertainty, looming legal challenges and a glut of emissions allowances on the market, rather than the success of cap-and-trade fulfilling its mandate; a carbon market and cap to backstop carbon pollution emissions reductions.
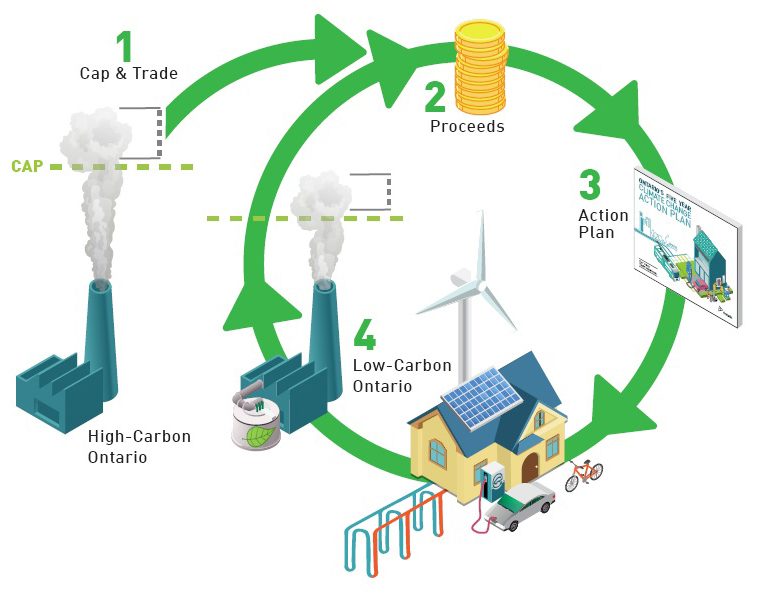
Before we dive into a deeper analysis of the latest auction results, let’s have a quick refresher on cap-and-trade. Cap-and-trade is a carbon pricing system that sets a declining limit on the amount of greenhouse gases (GHG) that industries within a particular jurisdiction (say, California) can emit. Companies operating in this region must obtain a permit — known as an allowance — for every ton of carbon they put into the atmosphere via an auction run by the state, province, etc. The permits can also be traded through the carbon market. California’s market is linked with Quebec, and Ontario plans to join the linked system next year.
It’s working!
The California system is a revenue-positive carbon pricing system, and less permits sold mean less financing to support a suite of complimentary programs to drive emission reduction – a setup the majority of Canadians prefer. So the poor auction is a bit of a blow, but ultimately, the best indicator of California’s cap-and-trade success is whether GHG emissions are coming down. As we reported back in November – this certainly appears to be the case. Emissions have been reduced, in the face of increasing employment levels and overall state GDP. It’s also important to understand that in California’s case, cap-and-trade is really meant as a backstop, a fail-safe to ensure that emissions do come down. But the heavy lifting is done by complementary policies: a low-carbon fuel standard, a renewable portfolio standard, and clean car laws, to name a few.
 Why 18%?
Legal challenges of California’s cap-and-trade system program design – including a long-running lawsuit filed by the California Chamber of Commerce seeking to have the system declared an illegal business tax, and uncertainty around program continuation past 2020 are clouding the market with uncertainty and could be driving participants to hold off on purchasing allowances until a better picture of its future emerges. Additionally, the auction in November was the last time participants were able to buy allowances at the 2016 price floor. Every year the floor price of the permit’s increase by 5%, plus the rate of inflation. The 2017 price increase could explain the strong performance back in November and the lower demand now, compounding participants’ hope for clarity on legal issues.
Looking Ahead & Lessons for Ontario
Resolution on both legal challenges and program lifespan are slated for April 2017. Many analysts believe that increased certainty of cap-and-trade past 2020 will increase auction performance significantly.
At the end of the day, fluctuations should be expected in the cap-and-trade system, and the core function of the program – emission reduction – is operating successfully. For Ontario’s own system to thrive over the long-term, the program must be propelled by certainty, and a strong, consistent commitment by decision-makers to significant carbon reduction.